


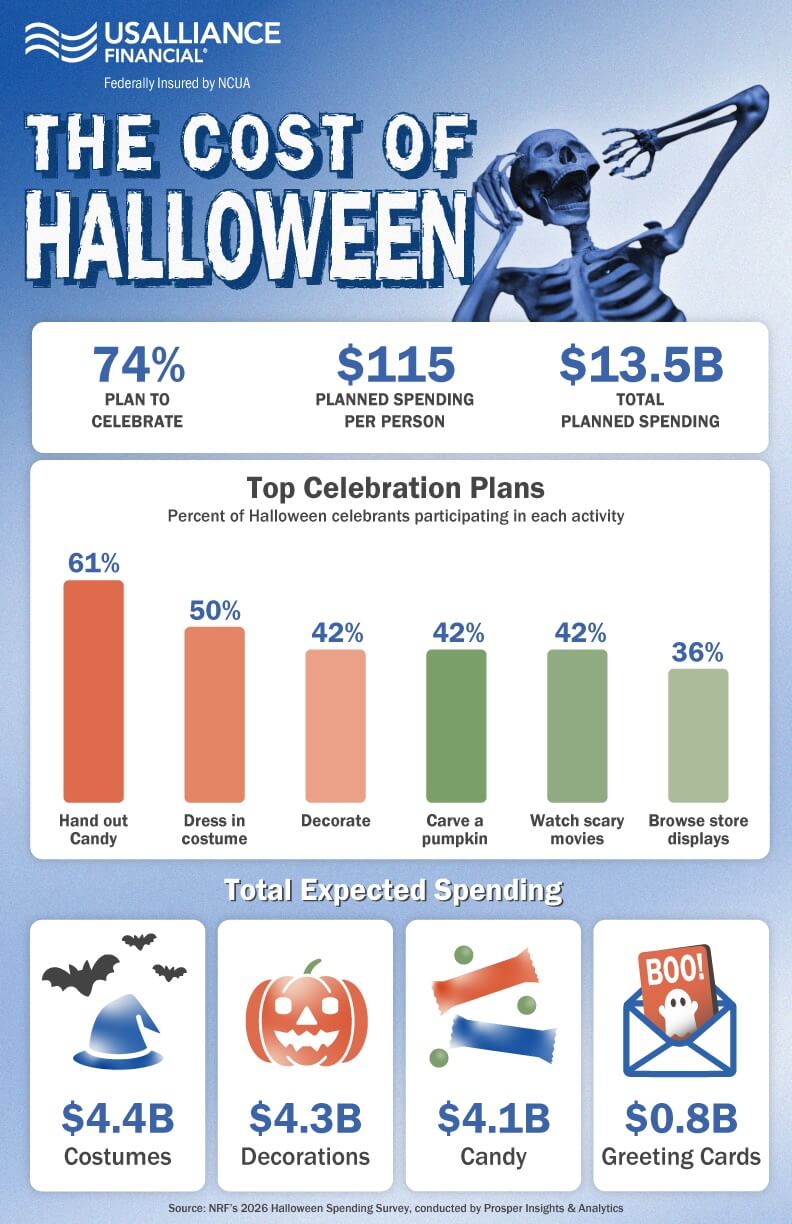
Halloween spending is holding steady at record highs. According to the National Retail Federation's annual survey (conducted with Prosper Insights & Analytics), consumers are expected to shell out $13.5 billion this year, just above last year's record of $13.1 billion. Per-person spending is also flat, at $115.14, compared to $114.45 in 2025.
The takeaway: Halloween enthusiasm isn't fading, but it's maturing into something a little more deliberate.
Where the money goes
Break down that $13.5 billion and a clear hierarchy emerges:
- Costumes: $4.4 billion
- Decorations: $4.3 billion
- Candy: $4.1 billion
- Greeting cards: $0.8 billion
Costumes slightly surpass decorations as the largest Halloween expense, highlighting that for many people, the holiday is still primarily about dressing up.
Where people shop
Discount stores remain the go-to destination for Halloween shopping, capturing 39% of shoppers, followed by specialty Halloween and costume stores at 32% and online retailers at 27%.
One notable shift: local and small businesses are seeing more love. 13% of consumers now plan to shop local for Halloween, almost double the 7% who did a decade ago in 2016. It's a small slice of the pie, but the trend line suggests shoppers are increasingly willing to support neighborhood retailers over big-box convenience.

Spending smart, not less
While Halloween spending remains strong, consumers are still keeping a close eye on costs. When faced with higher-than-expected prices, they plan to respond by:
- Comparison shopping (31%)
- Hunting for coupons or sales (26%)
- Buying reusable or repurposable items (34%), things that can come back next year or double for another occasion
That last stat is telling. More than a third of shoppers are thinking beyond a single night, treating Halloween purchases as investments rather than one-time costs.
How people celebrate
With 74% of consumers planning to celebrate this year, the traditions remain fairly consistent:
| Activity | Participation |
|---|---|
| Handing out candy | 61% |
| Wearing a costume | 50% |
| Decorating | 42% |
| Carving a pumpkin | 42% |
| Watching scary movies | 42% |
| Browsing store displays | 36% |
The bottom line
Halloween 2026 looks a lot like Halloween 2025: big spending, steady enthusiasm, and a growing streak of practicality. Consumers aren't cutting back, they're just getting smarter about where every dollar goes.




 NMLS #562301
Comments